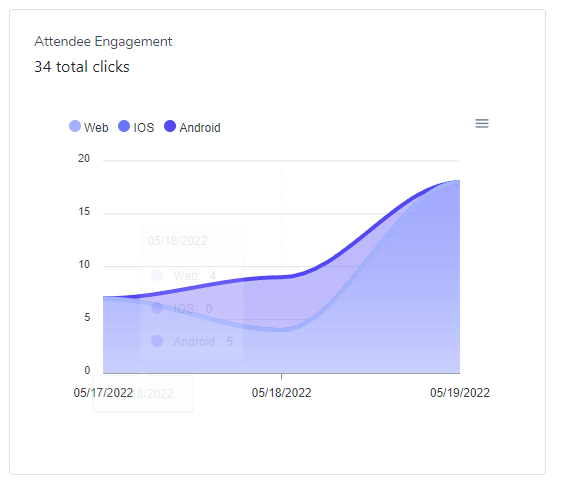
Attendee Engagement
Attendee engagement graph shows how much interaction your event is getting, during a specific date range. This graph will indicate how many click or tap actions your event has received. While the total clicks is the aggregate of all devices, you can easily view the device breakdown as well. Showing how much interaction your event is getting based on a specified device type